Creating Stunning Infographics in Adobe Illustrator: A Step-by-Step Guide
9jatechbros
- 0
- 55
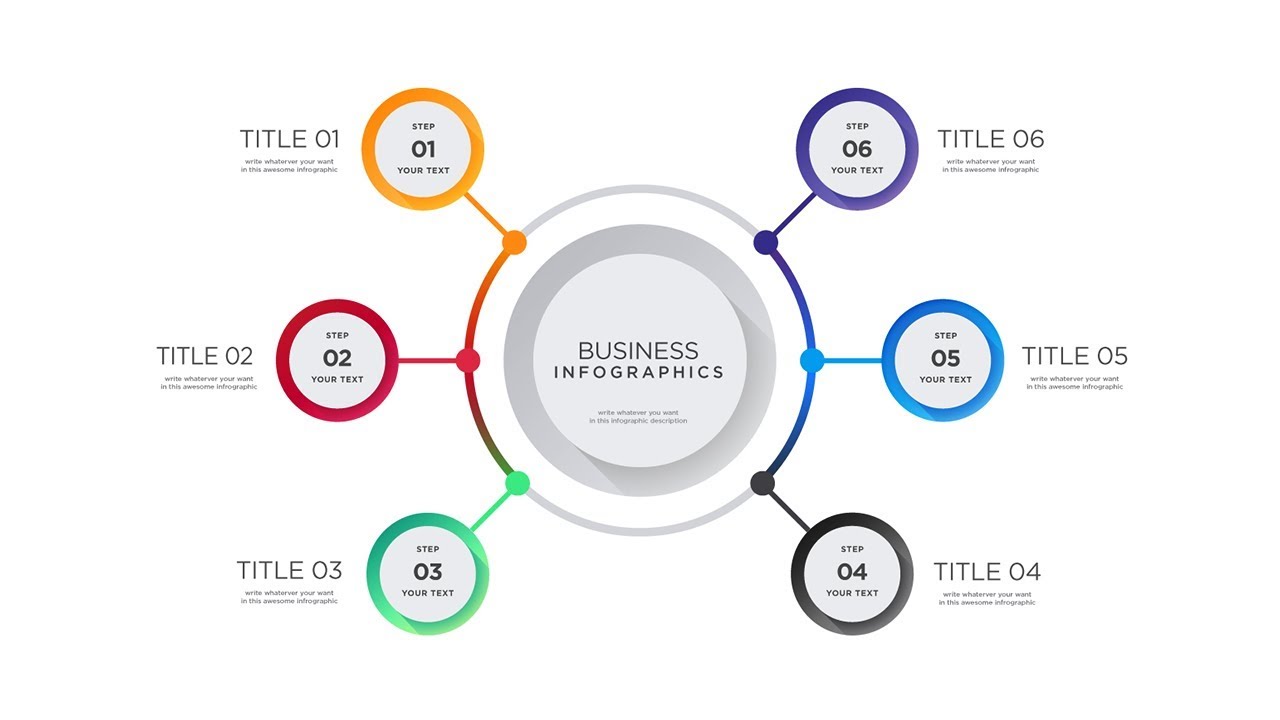
Infographics are an excellent way to present complex information in an easy-to-understand, visually appealing format. Adobe Illustrator is a powerful tool for creating these infographics, thanks to its versatility and array of design features. This step-by-step guide will take you through the process of designing stunning infographics from scratch.
Step 1: Planning Your Infographic
Define Your Purpose
Before you start designing, it’s crucial to understand the purpose of your infographic. Are you explaining a process, comparing data, or illustrating a concept? Knowing your objective will guide your design decisions.
Research Your Content
Gather all the data and information you need for your infographic. Make sure your sources are credible and that you have all the necessary facts and figures. This step is vital as it forms the foundation of your infographic.
Sketch Your Layout
Create a rough sketch of your infographic layout. Decide where each piece of information will go and how it will be presented. This will help you visualize the final product and ensure a logical flow of information.

Step 2: Setting Up Your Workspace
Create a New Document
Open Adobe Illustrator and create a new document (File > New). Set the dimensions based on your intended output, such as A4 for print or a specific pixel size for web use. Choose a resolution of 300 DPI for print or 72 DPI for web.
Organize Layers
Use layers to organize different elements of your infographic. For example, create separate layers for text, icons, graphs, and backgrounds. This makes it easier to edit and manage your design.
Set Up Guides and Grids
Enable rulers (View > Rulers > Show Rulers) and create guides (View > Guides > Make Guides) to help you align elements accurately. Using a grid (View > Show Grid) can also assist in maintaining a clean and organized layout.
Step 3: Designing Your Infographic
Choosing the Right Tools
Adobe Illustrator offers a range of tools perfect for creating infographics. Familiarize yourself with the following:
1. Pen Tool: For drawing custom shapes and lines.
2. Shape Tools: For creating basic shapes like rectangles, circles, and polygons.
3. Type Tool: For adding and formatting text.
4. Line Segment Tool: For drawing straight lines and grids.
Creating Shapes and Icons
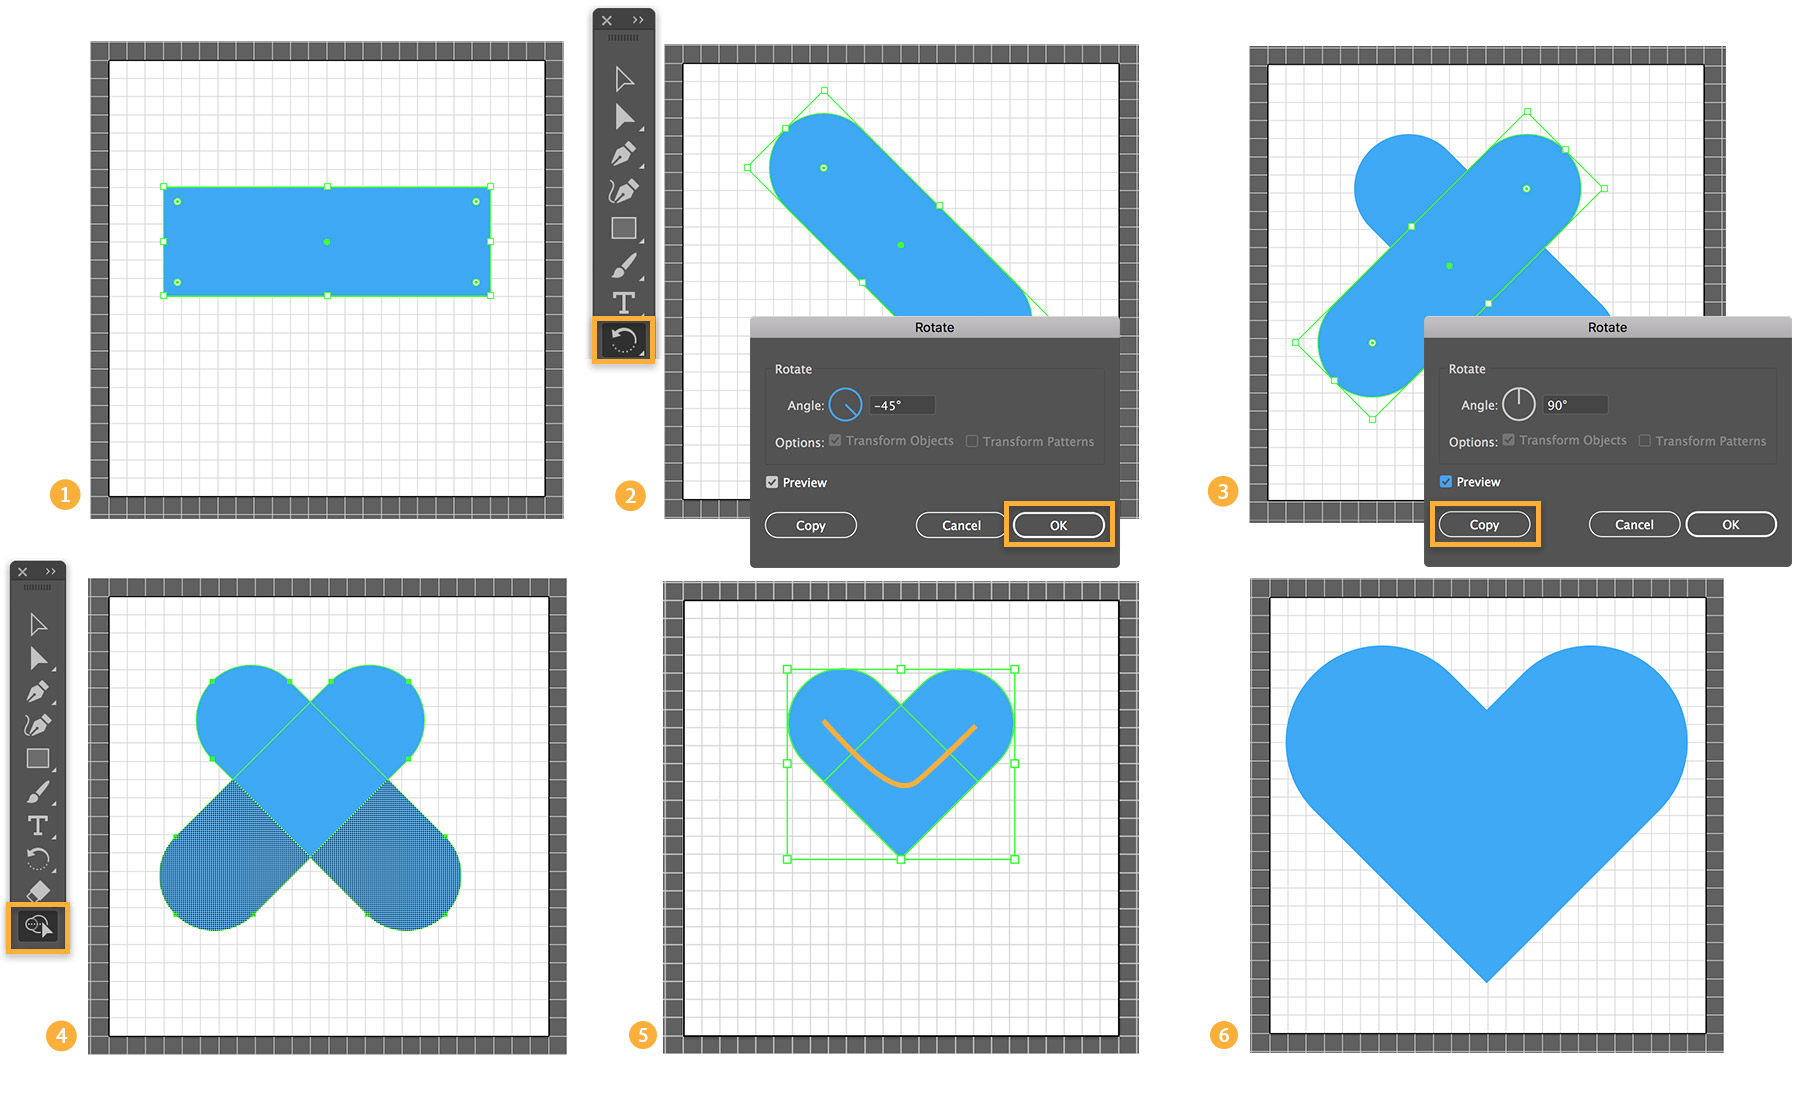
1. Basic Shapes: Use the shape tools to create basic shapes. Hold Shift while dragging to maintain proportions (e.g., perfect circles or squares).
2. Custom Icons: Draw custom icons with the Pen Tool or import pre-made icons from resources like the Noun Project.

Adding Text
1. Typography: Choose fonts that are legible and match the style of your infographic. Use different font sizes and weights to create a hierarchy.
2. Text Alignment: Align text properly using the alignment tools to ensure readability.
3. Annotations: Add annotations and labels to provide context to your data.
Incorporating Data Visualizations
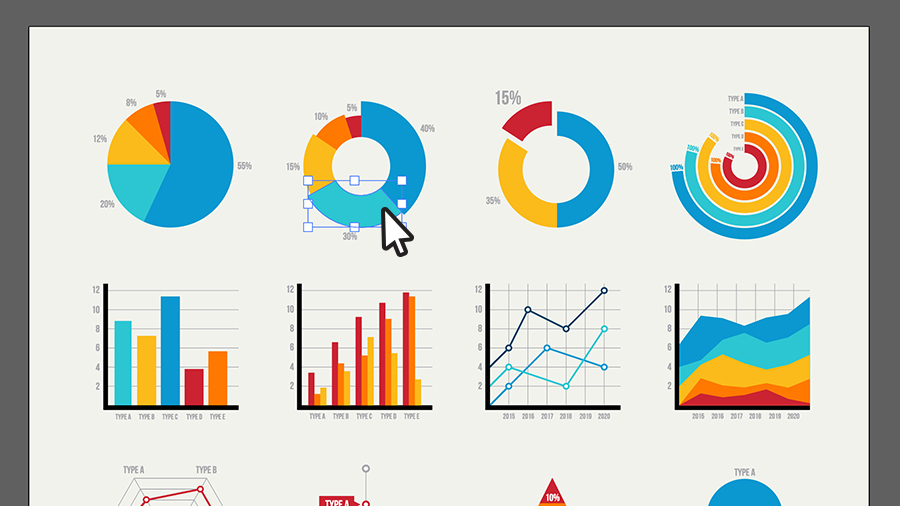
1. Graphs and Charts: Use the Graph Tool to create various types of charts (bar, pie, line, etc.). Input your data and customize the appearance.
2. Data Representation: Represent data visually with icons and illustrations. For example, use icon arrays to show quantities or percentages.
Applying Colors
1. Color Scheme: Choose a cohesive color scheme that aligns with your brand or topic. Tools like Adobe Color can help you create a palette.
2. Consistency: Maintain color consistency throughout your infographic. Use the Eyedropper Tool to match colors precisely.
3. Contrast: Ensure sufficient contrast between text and background for readability.
Step 4: Final Touches
Adding Backgrounds and Textures
1. Backgrounds: Create or import a subtle background that doesn’t distract from the main content. Gradients and light textures work well.
2. Textures: Add textures to elements for a more polished look. Use the Transparency panel to adjust opacity and blending modes.
Fine-Tuning Alignment
1. Align and Distribute: Use the Align panel to ensure elements are properly aligned and evenly distributed.
2. Snap to Grid: Enable snapping (View > Snap to Grid) to help with precise placement.
Reviewing and Editing
1. Proofreading: Double-check all text for spelling and grammatical errors.
2. Consistency Check: Ensure all visual elements are consistent in style, color, and alignment.
3. Feedback: Get feedback from others to identify any areas for improvement.

Step 5: Exporting Your Infographic
Choose the Right Format
1. For Web: Export your infographic as a PNG or JPEG (File > Export > Export As). Choose a resolution of 72 DPI.
2. For Print: Export as a PDF or high-resolution TIFF (File > Save As). Choose a resolution of 300 DPI.
Optimize for Sharing
1. File Size: Optimize the file size without losing quality, especially for web use.
2. Accessibility: Consider adding alt text for images if you’re posting the infographic online.
Conclusion
Creating stunning infographics in Adobe Illustrator involves careful planning, precise execution, and attention to detail. By following these steps, you can transform complex data into engaging visual stories. Practice regularly, experiment with different styles, and soon you’ll be able to produce professional-quality infographics that captivate your audience.


